Is your generative AI application giving the responses you expect? Are there less expensive large language models—or even free ones you can run locally—that might work well enough for some of your tasks?
Answering questions like these isn’t always easy. Model capabilities seem to change every month. And, unlike conventional computer code, LLMs don’t always give the same answer twice. Running and rerunning tests can be tedious and time consuming.
Fortunately, there are frameworks to help automate LLM tests. These LLM “evals,” as they’re known, are a bit like unit tests on more conventional computer code. But unlike unit tests, evals need to understand that LLMs can answer the same question in different ways, and that more than one response may be correct. In other words, this type of testing often requires the ability to analyze flexible criteria, not simply check if a given response equals a specific value.
The vitals package, based on Python‘s Inspect framework, brings automated LLM evals to the R programming language. Vitals was designed to integrate with the ellmer R package, so you can use them together to evaluate prompts, AI applications, and how different LLMs affect both performance and cost. In one case, it helped show that AI agents often ignore information in plots when it goes against their expectations, according to package author Simon Couch, a senior software engineer at Posit. Couch said over email that the experiment, done using a set of vitals evaluations dubbed bluffbench, “really hit home for some folks.”
Couch is also using the package to measure how well different LLMs write R code.
Vitals setup
You can install the vitals package from CRAN or, if you want the development version, from GitHub with pak::pak("tidyverse/vitals"). As of this writing, you’ll need the dev version to access several features used in examples for this article, including a dedicated function for extracting structured data from text.
Vitals uses a Task object to create and run evals. Each task needs three pieces: a dataset, a solver, and a scorer.
Dataset
A vitals dataset is a data frame with information about what you want to test. That data frame needs at least two columns:
input: The request you want to send to the LLM.target: How you expect the LLM to respond.
The vitals package includes a sample dataset called are. That data frame has a few more columns, such as id (which is never a bad idea to include in your data), but these are optional.
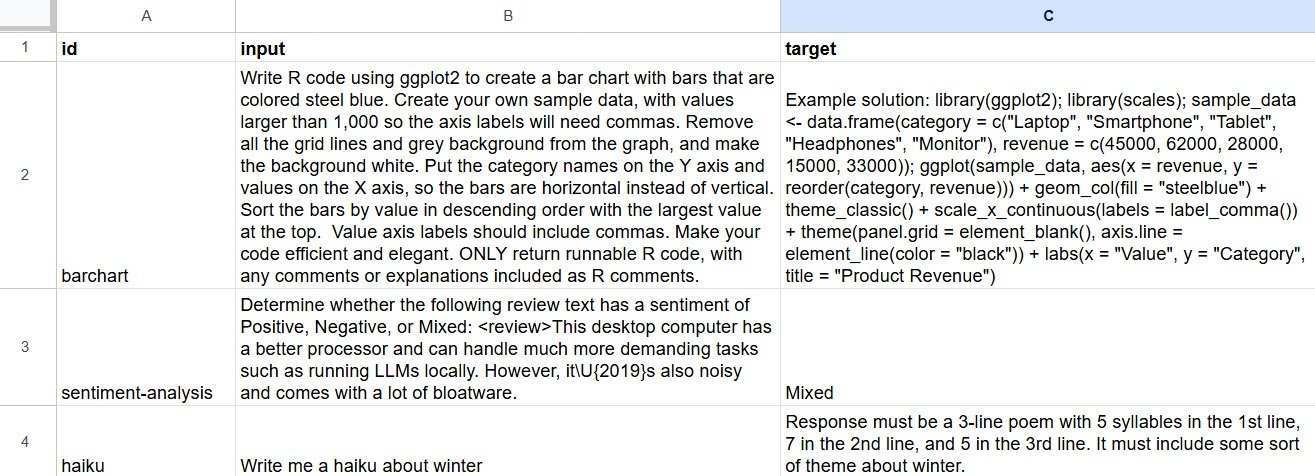
As Couch told posit::conf attendees a few months ago, one of the easiest ways to create your own input-target pairs for a dataset is to type what you want into a spreadsheet. Set up spreadsheet columns with “input” and “target,” add what you want, then read that spreadsheet into R with a package like googlesheets4 or rio.
Example of a spreadsheet to create a vitals dataset with input and target columns.
Sharon Machlis
Below is the R code for three simple queries I’ll use to test out vitals. The code creates an R data frame directly, if you’d like to copy and paste to follow along. This dataset asks an LLM to write R code for a bar chart, determine the sentiment of some text, and create a haiku.
my_dataset <- data.frame(
id = c("barchart", "sentiment-analysis", "haiku"),
input = c(
"Write R code using ggplot2 to create a bar chart with bars that are colored steel blue. Create your own sample data, with values larger than 1,000 so the axis labels will need commas. Remove all the grid lines and grey background from the graph, and make the background white. Put the category names on the Y axis and values on the X axis, so the bars are horizontal instead of vertical. Sort the bars by value in descending order with the largest value at the top. Value axis labels should include commas. Make your code efficient and elegant. ONLY return runnable R code, with any comments or explanations included as R comments.",
"Determine whether the following review text has a sentiment of Positive, Negative, or Mixed: This desktop computer has a better processor and can handle much more demanding tasks such as running LLMs locally. However, itU{2019}s also noisy and comes with a lot of bloatware. ",
"Write me a haiku about winter"
),
target = c(
'Example solution: ```library(ggplot2)rnlibrary(scales)rnsample_data <- data.frame(rn category = c("Laptop", "Smartphone", "Tablet", "Headphones", "Monitor"),rn revenue = c(45000, 62000, 28000, 15000, 33000)rn)rnggplot(sample_data, aes(x = revenue, y = reorder(category, revenue))) +rn # Add steel blue barsrn geom_col(fill = "steelblue") +rn theme_classic() +rn scale_x_continuous(labels = label_comma()) +rn theme(rn panel.grid = element_blank(),rn axis.line = element_line(color = "black")rn ) +rn labs(rn x = "Value",rn y = "Category",rn title = "Product Revenue - Sorted by Performance"rn )```',
"Mixed",
"Response must be a 3-line poem with 5 syllables in the 1st line, 7 in the 2nd line, and 5 in the 3rd line. It must include some sort of theme about winter."
)
)Next, I’ll load my libraries and set a logging directory for when I run evals, since the package will suggest you do that as soon as you load it:
library(vitals)
library(ellmer)
vitals_log_dir_set("./logs")
Here’s the start of setting up a new Task with the dataset, although this code will throw an error without the other two required arguments of solver and scorer.
my_task <- Task$new(
  dataset = my_dataset
)
If you’d rather use a ready-made example, you can use dataset = are with its seven R tasks.
It can take some effort to come up with good sample targets. The classification example was simple, since I wanted a single-word response, mixed. But other queries can have more free-form responses, such as writing code or summarizing text. Don’t rush through this part—if you want your automated “judge” to grade accurately, it pays to design your acceptable responses carefully.
Solver
The second part of the task, the solver, is the R code that sends your queries to an LLM. For simple queries, you can usually just wrap an ellmer chat object with the vitals generate() function. If your input is more complex, such as needing to call tools, you may need a custom solver. For this part of the demo, I’ll use a standard solver with generate(). Later, we’ll add a second solver with generate_structured().
It helps to be familiar with the ellmer R package when using vitals. Below is an example of using ellmer without the vitals package, with my_dataset$input[1], the first query in my dataset data frame, as my prompt. This code returns an answer to the question but doesn’t evaluate it.
Note: You’ll need an OpenAI key if you want to run this specific code. Or you can change the model (and API key) to any other LLM from a provider ellmer supports. Make sure to store any needed API keys for other providers. For the LLM, I chose OpenAI’s least expensive current model, GPT-5 nano.
my_chat <- chat_openai(model = "gpt-5-nano")
my_query <- my_dataset$input[1] # That variable holds the text of the first query I want to evaluate, in the dataset I created above
result <- my_chat$chat(my_query)
You can turn that my_chat ellmer chat object into a vitals solver by wrapping it in the generate() function:
# This code won't run yet without the tasks's third required argument, a scorer
my_task <- Task$new(
  dataset = my_dataset,
  solver = generate(my_chat) # Using my_chat that was created above
)
The Task object knows to use the input column from your dataset as the question to send to the LLM. If the dataset holds more than one query, generate() handles processing them.
Scorer
Finally, we need a scorer. As the name implies, the scorer grades the result. Vitals has several different types of scorer. Two of them use an LLM to evaluate results, sometimes referred to as “LLM as a judge.” One of vitals’ LLM-as-a-judge options, model_graded_qa(), checks how well the solver answered a question. The other, model_graded_fact(), “determines whether a solver includes a given fact in its response,” according to the documentation. Other scorers look for string patterns, such as detect_exact() and detect_includes().
Some research shows that LLMs can do a decent job in evaluating results. However, like most things involving generative AI, I don’t trust LLM evaluations without human oversight.
Pro tip: If you’re testing a small, less capable model in your eval, you don’t want that model also grading the results. Vitals defaults to using the same LLM you’re testing as the scorer, but you can specify another LLM to be your judge. I usually want a top-tier frontier LLM for my judge unless the scoring is straightforward.
Here’s what the syntax might look like if we were using Claude Sonnet as a model_graded_qa() scorer:
scorer = model_graded_qa(scorer_chat = chat_anthropic(model = "claude-sonnet-4-6"))Note that this scorer defaults to setting partial credit to FALSE—either the answer is 100% accurate or it’s wrong. However, you can choose to allow partial credit if that makes sense for your task, by adding the argument partial_credit = TRUE:
scorer = model_graded_qa(partial_credit = TRUE, scorer_chat = chat_anthropic(model = "claude-sonnet-4-6"))I started with Sonnet 4.5 as my scorer, without partial credit. It got one of the gradings wrong, giving a correct score to R code that did most things right for my bar chart but didn’t sort by descending order. I also tried Sonnet 4.6, released just this week, but it also got one of the grades wrong.
Opus 4.6 is more capable than Sonnet, but it’s also about 67% pricier at $5 per million tokens input and $25 per million output. Which model and provider you choose depends in part on how much testing you’re doing, how much you like a specific LLM for understanding your work (Claude has a good reputation for writing R code), and how important it is to accurately evaluate your task. Keep an eye on your usage if cost is an issue. If you’d rather not spend any money following the examples in this tutorial, and you don’t mind using less capable LLMs, check out GitHub Models, which has a free tier. ellmer supports GitHub Models with chat_github(), and you can also see available LLMs by running models_github().
Keep an eye on your usage if cost is an issue. If you’d rather not spend any money following the examples in this tutorial, and you don’t mind using less capable LLMs, check out GitHub Models, which has a free tier. ellmer supports GitHub Models with chat_github(). (You can also see available LLMs by running models_github().)
Below, I’ve added model_graded_qa() scoring to my_task, and I also included a name for the task. However, I’d suggest not adding a name to your task if you plan to clone it later to try a different model. Cloned tasks keep their original name, and as of this writing, there’s no way to change that.
my_task <- Task$new(
  dataset = my_dataset,
  solver = generate(my_chat), # Using my_chat that was created above
  scorer = model_graded_qa(
    scorer_chat = chat_anthropic(model = "claude-opus-4-6")
  ),
  name = "Basic gpt-5-nano test with Opus judging"
)
Now, my task is ready to use.
Run your first vitals task
You execute a vitals task with the task object’s $eval() method:
my_task$eval()The eval() method launches five separate methods: $solve(), $score(), $measure(), $log(), and $view(). After it finishes running, a built-in log viewer should pop up. Click on the hyperlinked task to see more details:
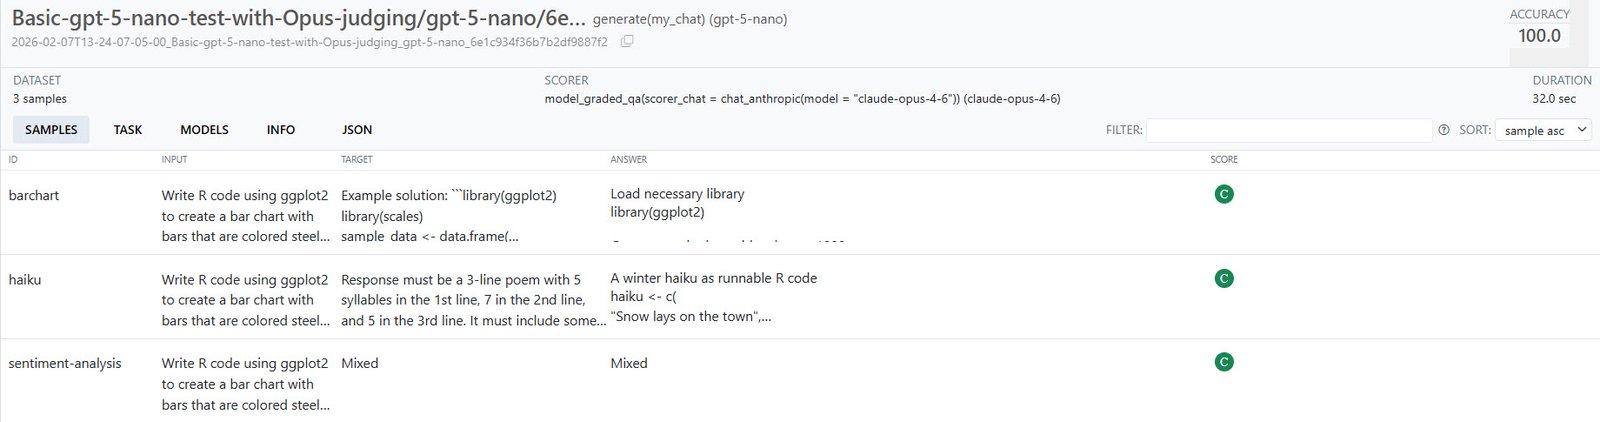
Details on a task run in vitals’ built-in viewer. You can click each sample for additional info.
Sharon Machlis
“C” means correct and “I” stands for incorrect, and there could have been “P” for partially correct if I had allowed partial credit.
If you want to see a log file in that viewer later, you can invoke the viewer again with vitals_view("your_log_directory"). The logs are just JSON files, so you can view them in other ways, too.
You’ll probably want to run an eval multiple times, not just once, to feel more confident that an LLM is reliable and didn’t just get lucky. You can set multiple runs with the epochs argument:
my_task$eval(epochs = 10)The accuracy of bar chart code on one of my 10-epoch runs was 70%—which may or may not be “good enough.” Another time, that rose to 90%. If you want a true measure of an LLM’s performance, especially when it’s not scoring 100% on every run, you’ll want a good sample size; margin of error can be significant with just a few tests. (For a deep dive into statistical analysis of vitals results, see the package’s analysis vignette.)
It cost about 14 cents to use Sonnet 4.6 as a judge versus 27 cents for Opus 4.6 on 11 total epoch runs of three queries each. (Not all these queries even needed an LLM for evaluation, though, if I were willing to separate the demo into multiple task objects. The sentiment analysis was just looking for “Mixed,” which is simpler scoring.)
The vitals package includes a function that can format the results of a task’s evaluation as a data frame: my_task$get_samples(). If you like this formatting, save the data frame while the task still exists in your R session:
results_df <- my_task$get_samples()
saveRDS(results_df, "results1.Rds")
You may also want to save the Task object itself.
If there’s an API glitch while you’re running your input queries, the entire run will fail. If you want to run a test for a lot of epochs, you may want to break it up into smaller groups so as not to risk wasting tokens (and time).
Swap in another LLM
There are several ways to run the same task with a different model. First, create a new chat object with that different model. Here’s the code for checking out Google Gemini 3 Flash Preview:
my_chat_gemini <- chat_google_gemini(model = "gemini-3-flash-preview")Then you can run the task in one of three ways.
1. Clone an existing task and add the chat as its solver with $set_solver():
my_task_gemini <- my_task$clone()
my_task_gemini$set_solver(generate(my_chat_gemini))
my_task_gemini$eval(epochs = 3)
2. Clone an existing task and add the new chat as a solver when you run it:
my_task_gemini <- my_task$clone()
my_task_gemini$eval(epochs = 3, solver_chat = my_chat_gemini)
3. Create a new task from scratch, which allows you to include a new name:
my_task_gemini <- Task$new(
  dataset = my_dataset,
  solver = generate(my_chat_gemini),
  scorer = model_graded_qa(
    partial_credit = FALSE,
    scorer_chat = ellmer::chat_anthropic(model = "claude-opus-4-6")
  ),
  name = "Gemini flash 3 preview"
)
my_task_gemini$eval(epochs = 3)
Make sure you’ve set your API key for each provider you want to test, unless you’re using a platform that doesn’t need them, such as local LLMs with ollama.
View multiple task runs
Once you’ve run multiple tasks with different models, you can use the vitals_bind() function to combine the results:
both_tasks <- vitals_bind(
  gpt5_nano = my_task,
  gemini_3_flash = my_task_gemini
)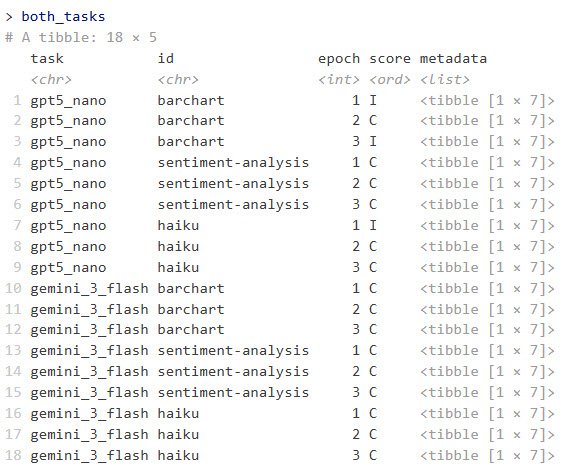
Example of combined task results running each LLM with three epochs.
Sharon Machlis
This returns an R data frame with columns for task, id, epoch, score, and metadata. The metadata column contains a data frame in each row with columns for input, target, result, solver_chat, scorer_chat, scorer_metadata, and scorer.
To flatten the input, target, and result columns and make them easier to scan and analyze, I un-nested the metadata column with:
library(tidyr)
both_tasks_wide <- both_tasks |>
  unnest_longer(metadata) |>
  unnest_wider(metadata)
I was then able to run a quick script to cycle through each bar-chart result code and see what it produced:
library(dplyr)

# Some results are surrounded by markdown and that markdown code needs to be removed or the R code won't run
extract_code <- function(text) {
  # Remove markdown code fences
  text <- gsub("```r\n|```\n|```", "", text)
  text <- trimws(text)
  text
}

# Filter for barchart results only
barchart_results <- both_tasks_wide |>
  filter(id == "barchart")

# Loop through each result
for (i in seq_len(nrow(barchart_results))) {
  code_to_run <- extract_code(barchart_results$result[i])
  score <- as.character(barchart_results$score[i])
  task_name <- barchart_results$task[i]
  epoch <- barchart_results$epoch[i]

  # Display info
  cat("n", strrep("=", 60), "n")
  cat("Task:", task_name, "| Epoch:", epoch, "| Score:", score, "n")
  cat(strrep("=", 60), "nn")

  # Try to run the code and print the plot
  tryCatch(
    {
      plot_obj <- eval(parse(text = code_to_run))
      print(plot_obj)
      Sys.sleep(3)
    },
    error = function(e) {
      cat("Error running code:", e$message, "n")
      Sys.sleep(3)
    }
  )
}

cat("nFinished displaying all", nrow(barchart_results), "bar charts.n")
Test local LLMs
This is one of my favorite use cases for vitals. Currently, models that fit into my PC’s 12GB of GPU RAM are rather limited. But I’m hopeful that small models will soon be useful for more tasks I’d like to do locally with sensitive data. Vitals makes it easy for me to test new LLMs on some of my specific use cases.
vitals (via ellmer) supports ollama, a popular way of running LLMs locally. To use ollama, download, install, and run the ollama application, and either use the desktop app or a terminal window to run it. The syntax is ollama pull to download an LLM, or ollama run to both download and start a chat if you’d like to make sure the model works on your system. For example: ollama pull ministral-3:14b.
The rollama R package lets you download a local LLM for ollama within R, as long as ollama is running. The syntax is rollama::pull_model("model-name"). For example, rollama::pull_model("ministral-3:14b"). You can test whether R can see ollama running on your system with rollama::ping_ollama().
I also pulled Google’s gemma3-12b and Microsoft’s phi4, then created tasks for each of them with the same dataset I used before. Note that as of this writing, you need the dev version of vitals to handle LLM names that include colons (the next CRAN version after 0.2.0 should handle that, though):
# Create chat objects
ministral_chat <- chat_ollama(
  model = "ministral-3:14b"
)

gemma_chat <- chat_ollama(
  model = "gemma3:12b"
)

phi_chat <- chat_ollama(
  model = "phi4"
)

# Create one task with ministral, without naming it
ollama_task <- Task$new(
  dataset = my_dataset,
  solver = generate(ministral_chat),
  scorer = model_graded_qa(
    scorer_chat = ellmer::chat_anthropic(model = "claude-opus-4-6")
  )
)

# Run that task object's evals
ollama_task$eval(epochs = 5)

# Clone that task and run it with different LLM chat objects
gemma_task <- ollama_task$clone()
gemma_task$eval(epochs = 5, solver_chat = gemma_chat)

phi_task <- ollama_task$clone()
phi_task$eval(epochs = 5, solver_chat = phi_chat)


# Turn all these results into a combined data frame
ollama_tasks <- vitals_bind(
  ministral = ollama_task,
  gemma = gemma_task,
  phi = phi_task
)
All three local LLMs nailed the sentiment analysis, and all did poorly on the bar chart. Some code produced bar charts but not with axes flipped and sorted in descending order; other code didn’t work at all.
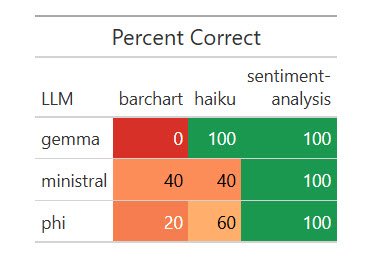
Results of one run of my dataset with five local LLMs.
Sharon Machlis
R code for the results table above:
library(dplyr)
library(gt)
library(scales)

# Prepare the data
plot_data <- ollama_tasks |>
  rename(LLM = task, task = id) |>
  group_by(LLM, task) |>
  summarize(
    pct_correct = mean(score == "C") * 100,
    .groups = "drop"
  )

color_fn <- col_numeric(
  palette = c("#d73027", "#fc8d59", "#fc8d59", "#fee08b", "#1a9850"),
  domain = c(0, 20, 40, 60, 100)
)

plot_data |>
  tidyr::pivot_wider(names_from = task, values_from = pct_correct) |>
  gt() |>
  tab_header(title = "Percent Correct") |>
  cols_label(`sentiment-analysis` = html("sentiment-
analysis")) |>
  data_color(
    columns = -LLM,
    fn = color_fn
  )
It cost me 39 cents for Opus to judge these local LLM runs—not a bad bargain.
Extract structured data from text
Vitals has a special function for extracting structured data from plain text: generate_structured(). It requires both a chat object and a defined data type you want the LLM to return. As of this writing, you need the development version of vitals to use the generate_structured() function.
First, here’s my new dataset to extract topic, speaker name and affiliation, date, and start time from a plain-text description. The more complex version asks the LLM to convert the time zone to Eastern Time from Central European Time:
extract_dataset <- data.frame(
id = c("entity-extract-basic", "entity-extract-more-complex"),
input = c(
"Extract the workshop topic, speaker name, speaker affiliation, date in 'yyyy-mm-dd' format, and start time in 'hh:mm' format from the text below. Assume the date year makes the most sense given that today's date is February 7, 2026. Return ONLY those entities in the format {topic}, {speaker name}, {date}, {start_time}. R Package Development in PositronrnThursday, January 15th, 18:00 - 20:00 CET (Rome, Berlin, Paris timezone) rnStephen D. Turner is an associate professor of data science at the University of Virginia School of Data Science. Prior to re-joining UVA he was a data scientist in national security and defense consulting, and later at a biotech company (Colossal, the de-extinction company) where he built and deployed scores of R packages. ",
"Extract the workshop topic, speaker name, speaker affiliation, date in 'yyyy-mm-dd' format, and start time in Eastern Time zone in 'hh:mm ET' format from the text below. (TZ is the time zone). Assume the date year makes the most sense given that today's date is February 7, 2026. Return ONLY those entities in the format {topic}, {speaker name}, {date}, {start_time}. Convert the given time to Eastern Time if required. R Package Development in PositronrnThursday, January 15th, 18:00 - 20:00 CET (Rome, Berlin, Paris timezone) rnStephen D. Turner is an associate professor of data science at the University of Virginia School of Data Science. Prior to re-joining UVA he was a data scientist in national security and defense consulting, and later at a biotech company (Colossal, the de-extinction company) where he built and deployed scores of R packages. "
),
target = c(
"R Package Development in Positron, Stephen D. Turner, University of Virginia (or University of Virginia School of Data Science), 2026-01-15, 18:00. OR R Package Development in Positron, Stephen D. Turner, University of Virginia (or University of Virginia School of Data Science), 2026-01-15, 18:00 CET.",
"R Package Development in Positron, Stephen D. Turner, University of Virginia (or University of Virginia School of Data Science), 2026-01-15, 12:00 ET."
)
)Below is an example of how to define a data structure using ellmer’s type_object() function. Each of the arguments gives the name of a data field and its type (string, integer, and so on). I’m specifying I want to extract a workshop_topic, speaker_name, current_speaker_affiliation, date (as a string), and start_time (also as a string):
my_object <- type_object(
  workshop_topic = type_string(),
  speaker_name = type_string(),
  current_speaker_affiliation = type_string(),
  date = type_string(
    "Date in yyyy-mm-dd format"
  ),
  start_time = type_string(
    "Start time in hh:mm format, with timezone abbreviation if applicable"
  )
)
Next, I’ll use the chat objects I created earlier in a new structured data task, using Sonnet as the judge since grading is straightforward:
my_task_structured <- Task$new(
  dataset = extract_dataset,
  solver = generate_structured(
    solver_chat = my_chat,
    type = my_object
  ),
  scorer = model_graded_qa(
    partial_credit = FALSE,
    scorer_chat = ellmer::chat_anthropic(model = "claude-sonnet-4-6")
  )
)


gemini_task_structured <- my_task_structured$clone()

# You need to add the type to generate_structured(), that's not included when a structured task is cloned
gemini_task_structured$set_solver(
  generate_structured(solver_chat = my_chat_gemini, type = my_object)
)

ministral_task_structured <- my_task_structured$clone()
ministral_task_structured$set_solver(
  generate_structured(solver_chat = ministral_chat, type = my_object)
)

phi_task_structured <- my_task_structured$clone()
phi_task_structured$set_solver(
  generate_structured(solver_chat = phi_chat, type = my_object)
)

gemma_task_structured <- my_task_structured$clone()
gemma_task_structured$set_solver(
  generate_structured(
    solver_chat = gemma_chat,
    type = my_object
  )
)

# Run the evaluations!

my_task_structured$eval(epochs = 3)
gemini_task_structured$eval(epochs = 3)
ministral_task_structured$eval(epochs = 3)
gemma_task_structured$eval(epochs = 3)
phi_task_structured$eval(epochs = 3)

# Save results to data frame
structured_tasks <- vitals_bind(
  gemini = gemini_task_structured,
  gpt_5_nano = my_task_structured,
  ministral = ministral_task_structured,
  gemma = gemma_task_structured,
  phi = phi_task_structured
)

saveRDS(structured_tasks, "structured_tasks.Rds")
It cost me 16 cents for Sonnet to judge 15 evaluation runs of two queries and results each.
Here are the results:
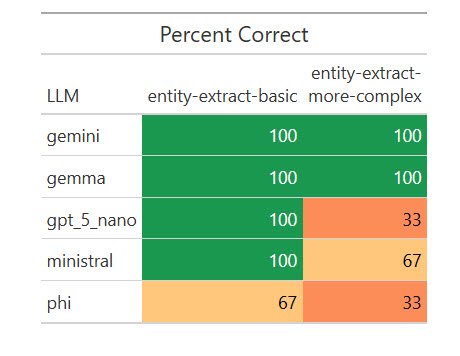
How various LLMs fared on extracting structured data from text.
Sharon Machlis
I was surprised that a local model, Gemma, scored 100%. I wanted to see if that was a fluke, so I ran the eval another 17 times for a total of 20. Weirdly, it missed on two of the 20 basic extractions by giving the title as “R Package Development” instead of “R Package Development in Positron,” but scored 100% on the more complex ones. I asked Claude Opus about that, and it said my “easier” task was more ambiguous for a less capable model to understand. Important takeaway: Be as specific as possible in your instructions!
Still, Gemma’s results were good enough on this task for me to consider testing it on some real-world entity extraction tasks. And I wouldn’t have known that without running automated evaluations on multiple local LLMs.
Conclusion
If you’re used to writing code that gives predictable, repeatable responses, a script that generates different answers each time it runs can feel unsettling. While there are no guarantees when it comes to predicting an LLM’s next response, evals can increase your confidence in your code by letting you run structured tests with measurable responses, instead of testing via manual, ad-hoc queries. And, as the model landscape keeps evolving, you can stay current by testing how newer LLMs perform—not on generic benchmarks, but on the tasks that matter most to you.
Learn more about the vitals R package
- Visit the vitals package website.
- Use the are dataset on GitHub to run evaluations on various LLMs to see how they perform writing R code.
- View Simon Couch’s presentation at posit::conf(2025).
Go to Source
Author: